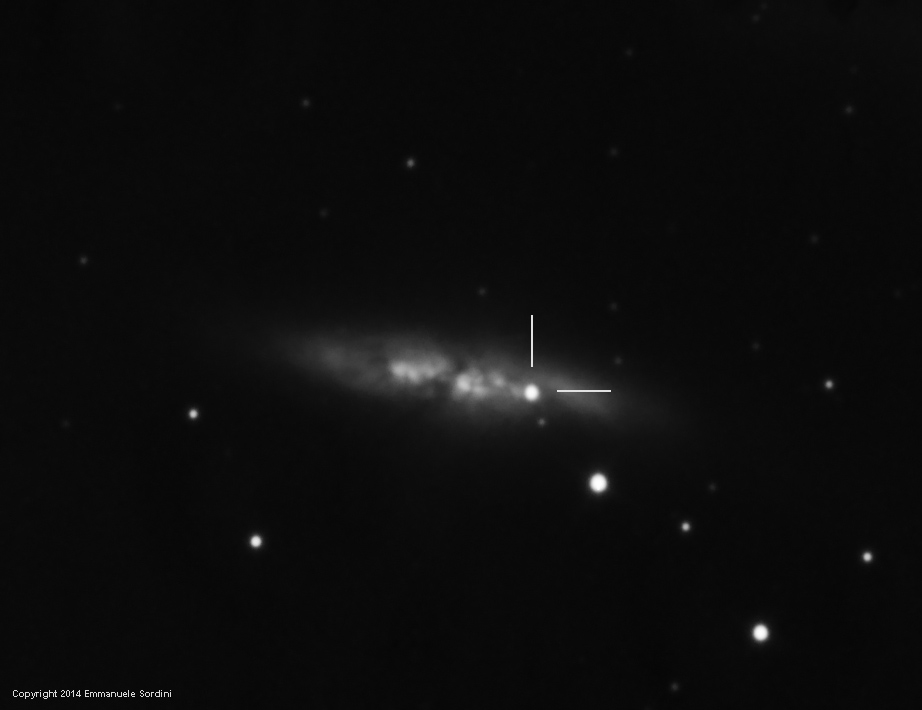
On January 21st, 2014, reports began circulating that a new supernova had just been discovered in M82 the Cigar Galaxy, close companion to the more famous Bode Galaxy, aka M81. Unfortunately my aurora-chasing trip to Norway from January 25th to February 1st (of which a detailed report will soon be published on my website) prevented me from spending any time on the observation of this interesting event. After all, this supernova blew up in a relatively nearby galaxy!
The supernova's brightness peaked at 10.5 mag (bright enough for visual observing through small telescopes and binoculars) on January 31st. During the month of February, unfortunately, I had a very hard time observing because the weather was overcast and rainy pretty much all the time. In the end I managed to pull off two observing session only, on the 12th and the 23rd. Here are the imaging data common to both sessions:
My first observing session, on February 12th, was jeopardized by awful seeing (I couldn't focus stars below 5-6 pixels FWHM) and high cirrus clouds, that forced me to trash half of the exposures. Nevertheless I managed to obtain to stack eight 300-s exposures together, for a total of 40 minutes. The supernova is clearly visible close to the center of the galaxy.

Fortunately, my second observing sessions, was blessed with much better seeing this time with 2.5-pixel FWHM stars. Consequently, my exposures contain a lot more detail: this is a clear example of how big of a difference seeing can make for good-quality images, all other factors being equal. Eleven days later, the supernova is still there.
M82 with Supernova SN2014J on February 23, 2014
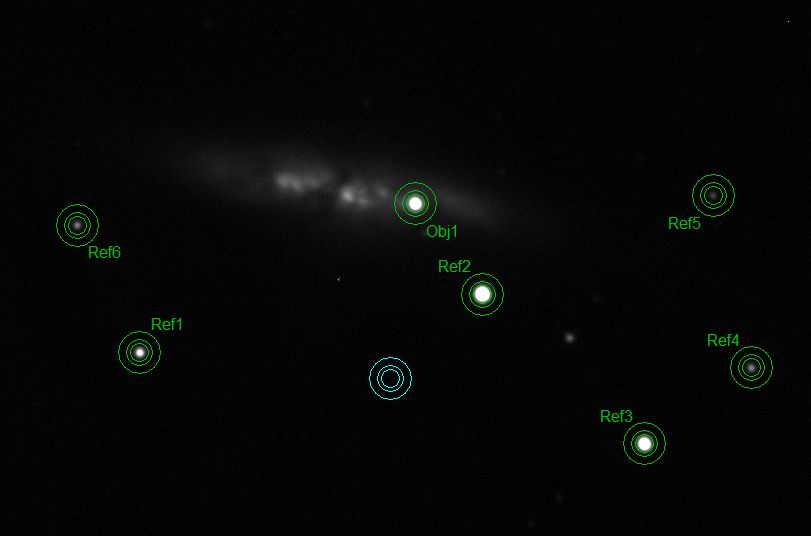
Even if two observations are by no means enough to plot any light curve whatsoever, I took the opportunity to give photometry a try, for the first time ever since buying my first CCD (its a shame, I know :-D ). Therefore I started off by looking around on the Internet on how to make this kind of measurements, and mainly on how to get the magnitudes for reference stars. After a bit of research I managed to obtain some decent results by following the steps below:
Important note: all measurements must be made on properly calibrated (i.e. by appyling dark and bias frames and flat fields) linear images without ANY kind of cosmetic processing; otherwise you'll end up with totally unreliable results.
I used six reference stars, as you can see in the following screenshot:

Below are the details of my measurements:
| Date | Mean JD | # of images | SN2014 magnitude | Std dev (magnitudes) |
| February 12th, 2014 | 2456701.38 | 7 | 10.920 | 0.062 |
| February 23rd, 2014 | 2456712.41 | 12 | 11.293 | 0.005 |
Over an eleven-day timespan a ~0.373 magnitude decrease was detected, which means about a 30% drop in brightness. My results are consistent with data from other observers.
I am no photometry or supernova expert. Nevertheless, it was very interesting to follow its behavior and to measure its brightness. For best precision I should have used standard UBVRI filters, which are very expensive and I'd say, overkill as photometry is not my top priority. Making these measurements even through plain differential photometry is very instructive and rewarding and, once one gets the hang of it, it is rather simple. This is a field where amateurs can provide results of some scientific relevance.

Leave a comment