This post is also available in: Italiano (Italian)
Below is a plot with real-time SQM measurements from a Unihedron SQM-LE (“Sky Quality Meter – LE) meter installed in my backyard. See below for a detailed explanation.
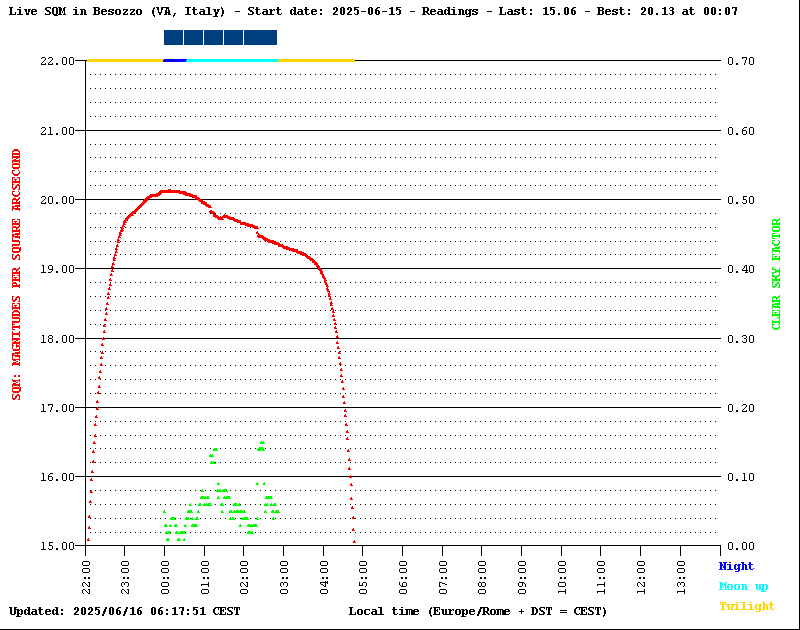
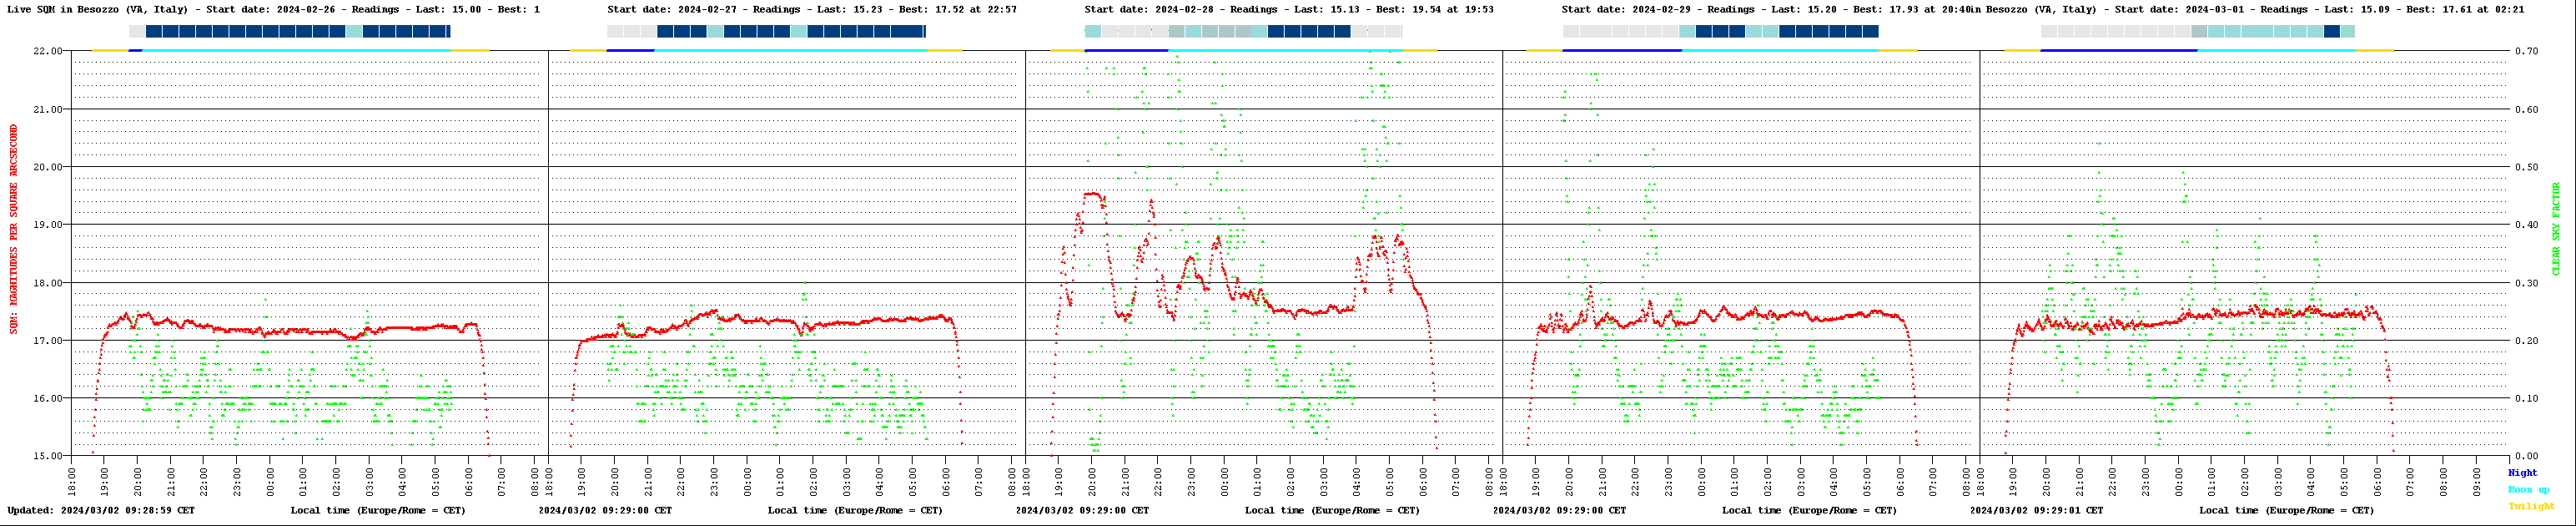
SQM chart for the last five days. Please click the image for a larger version.
Intro: Light Pollution
I leave it to IDA (International Dark-sky Association)’s homepage to briefly explain what light pollution is all about:
“Less than 100 years ago, everyone could look up and see a spectacular starry night sky. Now, millions of children across the globe will never experience the Milky Way where they live. The increased and widespread use of artificial light at night is not only impairing our view of the universe, it is adversely affecting our environment, our safety, our energy consumption and our health.
The inappropriate or excessive use of artificial light – known as light pollution – can have serious environmental consequences for humans, wildlife, and our climate. Light pollution is a side effect of industrial civilization. Its sources include building exterior and interior lighting, advertising, commercial properties, offices, factories, streetlights, and illuminated sporting venues.
With much of the Earth’s population living under light-polluted skies, over lighting is an international concern. If you live in an urban or suburban area all you have to do to see this type of pollution is go outside at night and look up at the sky. […]“
As much of the Earth’s population, I myself live in a heavily light-polluted area. Therefore, a while ago I decided to set up a SQM-LE sensor in my backyard in order to measure and monitor light pollution in my neighborhood.
My Installation and Chart Explanation
The SQM-LE is basically a device for measuring dark sky background brightness: the LE version has an Ethernet interface which can be hooked up to a LAN. I have developed my own Java application which polls the meter for sky background brightness every minute. Each SQM reading is then saved to a local database together with some additional information, including the following:
- Date (with DST offset)
- Julian day
- Altitude of Sun and Moon (to compute astronomical darkness)
- CSF (“Clear Sky Factor”) values. See below for a detailed explanation.
The SQM chart contains the following information:
- Red dots: SQM readings in magnitudes per square arcsecond (“mpsas” for short). Only values above 6.0 mpsas are stored.
- Green dots: CSF (“Clear Sky Factor”). CSF values above maximum are plotted just below the “twilight line”
A colored line in the top section of the chart (“twilight line”) gives information about the current darkness situation:
- Yellow: twilight (Sun’s altitude > -18°)
- Cyan: Moon above horizon
- Blue: true astronomical darkness (Sun’s altitude < -18° and Moon below horizon)
The chart is updated by my software every minute and uploaded to my website every five minutes.
The Clear Sky Factor
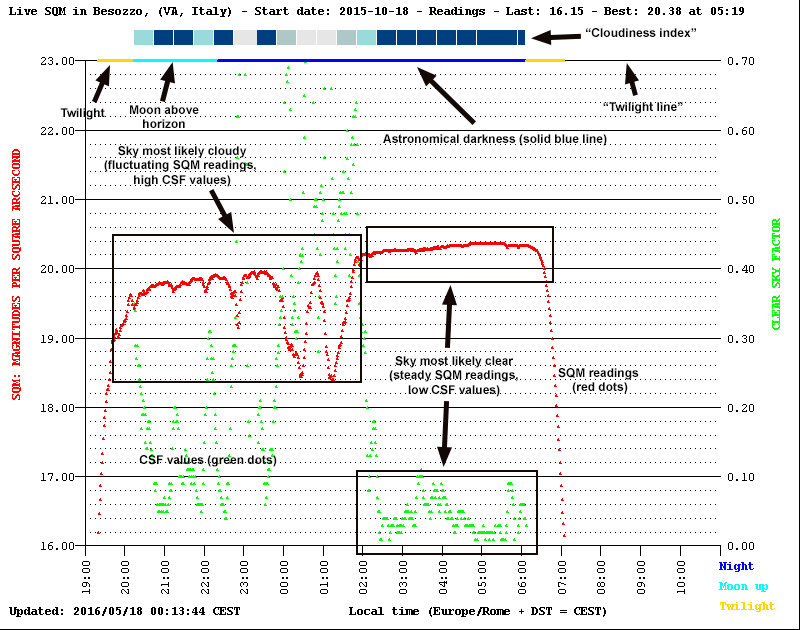
SQM values can be affected by a number of different factors such as: clouds, humidity, sky transparency, presence of the Moon, presence of lights nearby, etc. As a general rule of thumb, however, it was noticed that the SQM value fluctuates more when clouds are overhead. Furthermore, SQM readings under a cloudy sky will be numerically lower (meaning higher sky brightness) than under a clear sky, especially if you live in a light-polluted area, because the cloud bottom reflects light pollution back to the ground.
The CSF (short for “Clear Sky Factor”) is basically an indication of how big fluctuations in SQM values are, and is computed as the sum of the absolute differences (that is, Σ | SQM[i] – SQM [i-1] |) in the last ten SQM readings each taken one minute apart. Of course, given the number of factors that could influence the result, the CSF is not reliable enough and therefore should not be used as a replacement for a real cloud sensor: however, it is indeed a pretty good indicator of a cloudy sky.
At present, CSF values are computed and stored during astronomical night (Sun’s altitude < -18°) and when the Moon is up. A coarser but more intuitive “cloudiness indicator” is provided as a quick reference with boxes of different colors at the top of the chart. Each box spans half an hour and uses the following color coding:

For my site and my SQM-LE unit, I have noticed that
- CSF values below 0.10 indicate clear sky
- CSF values ranging between 0.10 and 0.30 indicate the presence of high cirrus clouds
- CSF values above 0.30 indicate the presence of mid- and low-altitude clouds. Generally, the lower the clouds, the higher the CSF value. However, there are some cases where low CSF values are reported even with bad weather (e.g. very hazy conditions or heavy rain).
- Low-lying clouds will cause the SQM reading to hover around 18 mag/arcsec^2, whereas usually clear sky means SQM values above 19 mag/arcsec^2 (with a peak of 20.4-20.5 mag/arcsec^2 recorded on the clearest and most transparent nights).
Here are some references on the CSF experiment: